I’ve been seeing a lot of discourse about Temple on my twitter feed for the past few days, which, in my opinion, has largely been misguided. Like Deepinder said, the best way to like (or hate) a pre-release product is to read the damn research.
So I decided to spend this Diwali weekend doing that, and broke it down in a more digestible and opinionated way so most curious people can follow along.
Fair warning before we get into this - I’m far from a medical professional, I just happen to have experiences with wearables and BLE tech I can hack, am decent at exploring topics I have no business exploring with AI agents and have watched one too many videos by the quantified scientist.
and no, I don’t have any involvement with Temple, I was just bored
The papers
So there’s largely 4 main documents backing this device at the moment, and they’re awaiting peer review as of today, so take them with a few grains of salt.
-
The heart rate accuracy study - covered 43 healthy adults on treadmills wearing 6 optical devices + a chest-strap for reference. The raw and cleaned recordings are public under a CC BY-NC license, which we work with below.
-
The Doppler preprint - BrainFlow against transcranial Doppler ultrasound (TCD). This one covers the brain blood flow tracking work.
-
The NIRS preprint - BrainFlow against near-infrared spectroscopy (TD-NIRS), 44 men across 60 sessions, separating signals from the brain and scalp layers.
-
The age preprint - 89 pulse-waveform features compared against chronological age, arguing the temple is a richer measurement site than the wrist.
The science page also links background physiology for Entropy and Span, Temple’s broader health scores, which is less interesting for now.
The Good
It’s (likely) a really good monitoring device
As far as data goes, it’s amazing -- which itself is a really cool achievement, because it stands shoulder-to-shoulder with years of R&D and shipping from the likes of WHOOP, Oura, Fitbit and more.
I recomputed the scores from the raw data and public files, and every one matches the paper to two decimal places, so the headline arithmetic checks out!
The graphs here come from those same files: Temple’s cleaned versions (where they removed sustained failure episodes) and my all-valid rerun (where nothing gets removed).
For heart rate on the treadmill, we get these stats:
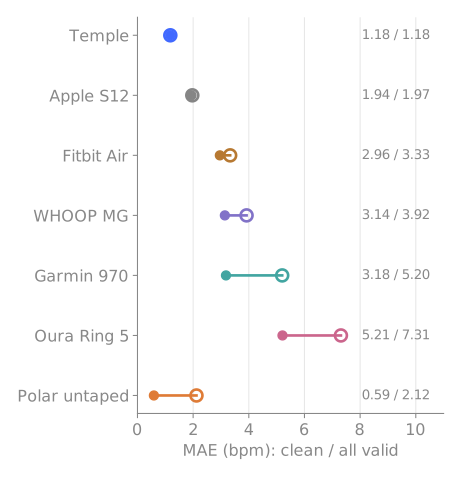
Of course, treadmill walking and running is one of the simpler tasks for optical sensors to track, so we still need data across outdoor running, lifting, cycling and daily life for more context - but this serves as a pretty good starting point.
Funnily enough, it did well where some other devices got stuck in the sustained failures, Temple’s score was 1.18 either way, whereas Garmin moves from 3.18 to 5.20, Oura from 5.21 to 7.31. So the actual result is consistency. In these recordings, Temple is the least vulnerable to prolonged large errors.
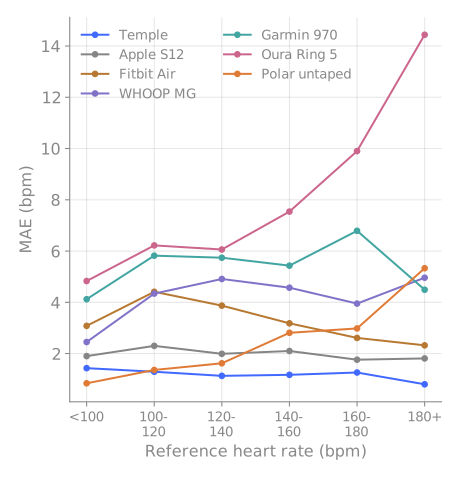
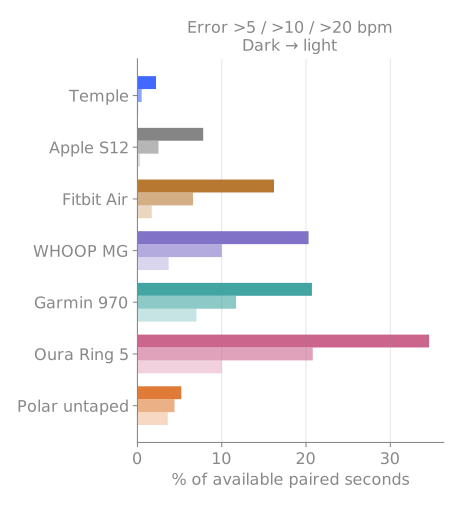
(These consider Pooled seconds instead of people, different from the paper's headline)
Temple stays near 1 bpm across heart-rate bands, Apple near 2, Oura climbs at higher heart rates. And the bad seconds barely exist: 2.2% of Temple’s paired seconds are more than 5 bpm off, against Oura’s 34.6%.
Matched on identical timestamps, Temple wins against Fitbit for 42/42 people, WHOOP for 40/43, Garmin for 43/43 and Oura for 43/43. (Reporting rates and coverage still matter when reading those - more on that in The Bad.)
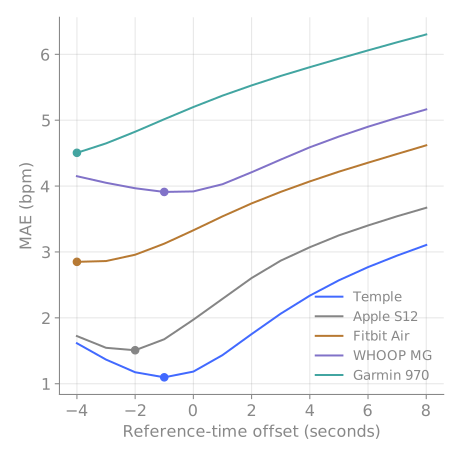
Small clock offsets didn’t rescue the others either. Even at each device’s best searched offset, Temple stayed lowest across the range.
reiterating, these are numbers from one treadmill session per person, at one site, against another wearable as the reference.
The most interesting wrinkle in the whole dataset: an untaped Polar chest strap is more accurate than Temple for 36 of 43 people, and Temple still wins on average because the strap fails hard on a few. More on that in The Bad, it’s worth the read.
The temple is (probably) a good place to keep a device
This is probably the biggest visual (and marketing :P) difference for Temple and it’s surprisingly hard to track from frontier research other than the paper’s sources, but seeing the numbers and no counterevidence, it likely has substance and is arguably really cool.
TLDR it argues that the pulse signal at your temple seems to carry much richer information than the one at your wrist, which makes it a better place for an activity tracker to be.
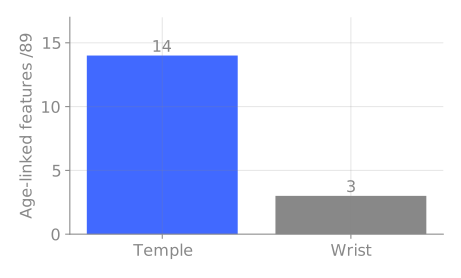
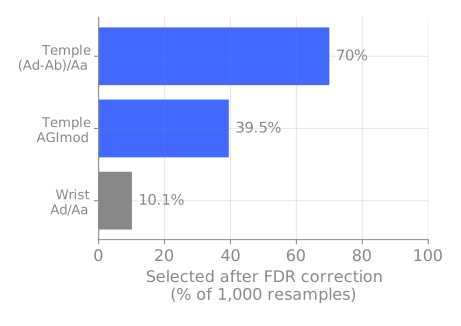
The only catch I saw from the paper included that the two sides used different people and different hardware (32 Hz at the temple, 500 Hz at the wrist), so anatomy isn’t fully isolated imo but even with that, the features do largely work out.
The dictation / speech-to-text part
I saw a lot of speculation about this on twitter, especially the not having a mic part. But funnily enough it’s probably the most heavily precedented researched part of the entire device, so I’m quite positive it can work out
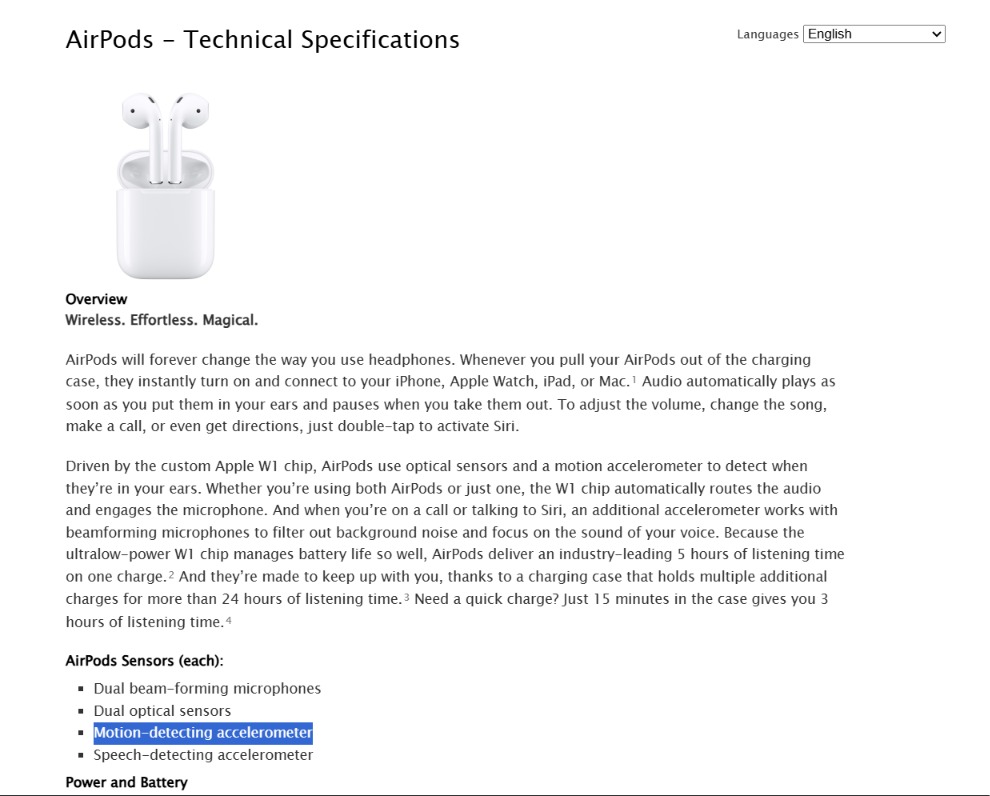
Throat microphones already pick speech up from vibration at the neck rather than from sound in the air and even the original AirPods technical spec lists a speech-detecting accelerometer, used alongside the mics to tell when you’re speaking.
There’s also been research on the temple, a 2007 Microsoft Research paper captured speech from it which was noise-resistant but distorted, so they paired it with a regular mic (worth remembering when people say no mic is needed) - and a 2013 study confirmed speech vibration is measurable at thirteen head and neck spots, temple included.
There does need to be some novel work to make it reliable (anybody who’s used pure signaling with transformers for even normal mics with speech-to-text can tell). The real test I’d want to see: how many words it recovers from the vibration signal alone, in a noisy room. I’m very positive they can pull it off, but that’s the number that proves it.
BrainFlow is pretty cool
BrainFlow is their proprietary score built from pulse shape, heart rate, temperature and optical signals.
This is the part I was most skeptical of going in, and also where Temple is doing something I couldn’t find any other consumer wearable even attempting: tracking blood-flow changes in your brain from a sensor sitting outside your skull.
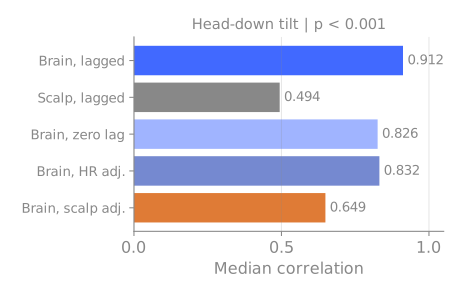
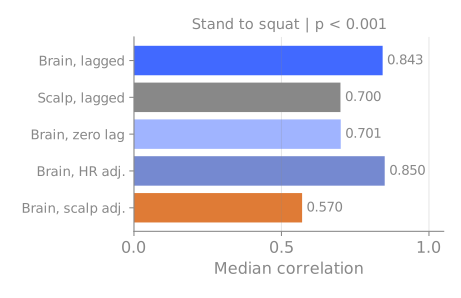
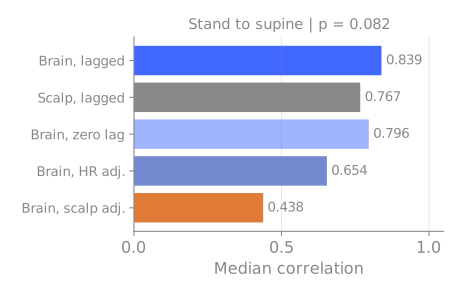
Both the Doppler and NIRS papers are pretty cool, I initially planned to write them all out here, but it doesn’t do them justice, you should read them if you’re interested.
But as a small TLDR, the Doppler paper checks if BrainFlow is seeing anything like actual brain blood flow, or is it just like a pulse reader?
It held up in the paper - correlations of 0.795 and 0.799 against the ultrasound but the better part was when people lay down, their heart rate went down while their brain blood flow went up, and BrainFlow went up with it. If this thing was just reading your pulse, it would have gone the wrong way but it didn’t
The NIRS paper checked if it’s observing the brain or just the scalp skin on top of it. Two of the three challenges show a clear brain-over-scalp advantage; the third (standing to lying down) doesn’t reach significance, at p = 0.082. And the headline 0.91 correlation in the first challenge drops to 0.65 once they adjust for the superficial signal. Still decent
To reiterate, what we largely see here is the metric can work, it may or may not be useful to most people -- WHOOP did something very similar with their ECG which is still relative and not approved everywhere but is still a cool upgrade
A lot of their experimentation and methods to try to disprove the results was cool and is worth a read.
The Bad
”Beats a chest strap” needs workshopping
This is one of the quotes a lot of people got (rightly!) weirded out by. The Polar H10 is probably one of the most accurate consumer devices you could get for tracking, so beating it in any capacity would genuinely be insane.
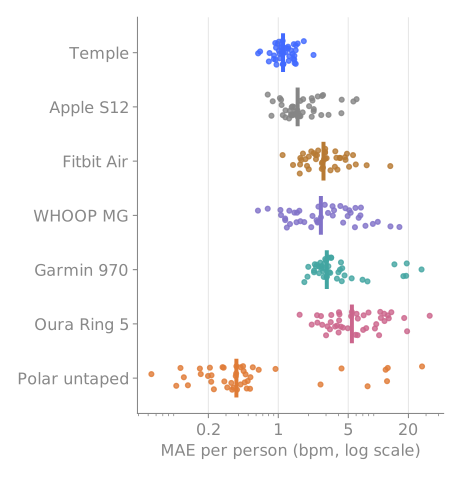
Plotting it out does show that the untaped Polar beats Temple for 36 of 43 people. Its median participant error is 0.38 bpm against Temple’s 1.12. But its worst participant averages 27.36 bpm off, while Temple’s worst is 2.25.
To their credit, yes, Temple wins the mean while losing for most people, because a few strap failures drag its average up.
But the other weird part about this observation (which is also mentioned in the paper) is that the second strap was worn lower than usual to make room for the reference strap. It was hard for me to separate it, but there’s a chance it could have contributed to its failures.
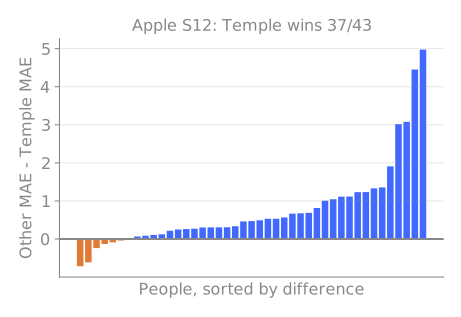
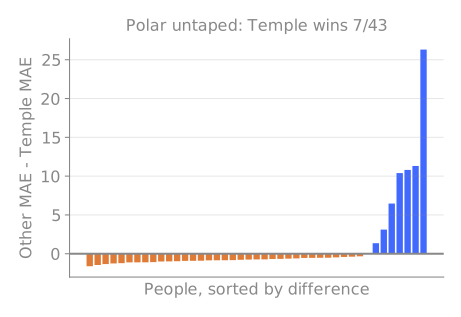
Per participant: other device's error minus Temple's. Positive favours Temple.
The all-valid mean difference against the untaped Polar is 0.93 bpm in Temple’s favour, but the participant-bootstrap 95% interval runs from -0.34 to 2.66. It crosses zero. “Temple’s mean was lower in this sample” holds; “Temple is definitively more accurate than a chest strap” doesn’t.
The Bad?
You likely won’t feel too much of a difference from other wearables
Temple is a wearable. Just like your other activity trackers. You won’t feel much difference in the numbers you get from your Apple Watches to WHOOP bands to FitBit Airs to Temple, they’re all optimized really well and have marginal level of differences, which is actually great.
What matters is sampling and available seconds for data, which almost all of them do well
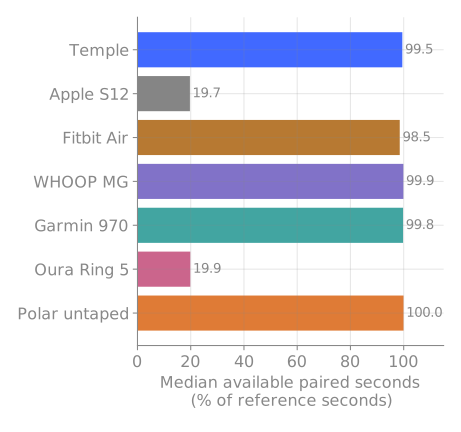
Apple and Oura export roughly one value every five seconds; the rest are near-continuous.
Placement changes the result
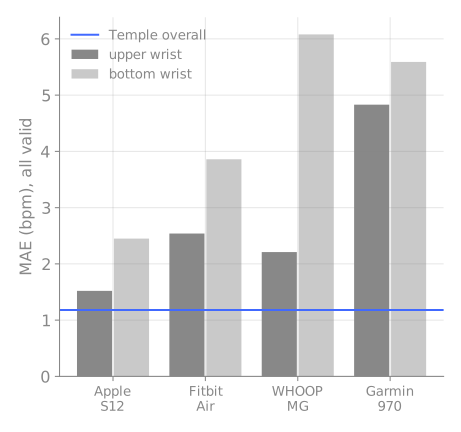
There’s a chance I’m reading too much into it, but in multiple papers, it was mentioned how optical devices’ placements were shifted to accommodate multiple of them, the issue with that notion is that the results can actually be quite variable because of it.
It’s a non-issue for most normal use, but does matter for research, but just thought it’s important to bring up.
Some Other Miscellaneous Nitpicks
-
The cohorts are narrow. Young, healthy, mostly male, one site, scheduled challenges, prescribed stillness. Free-living use, older people, and anyone with actual health conditions are untested.
-
The brain claims still outrun the brain evidence. The correlations come from modelled references in controlled postures, the algorithms differ between the studies, and nothing tests ordinary daily life (which to be fair, is common with other wearables too.)
How everyone else started
Oura took Kickstarter orders in August 2015, according to its company history. A 2017 independent study of the first-generation ring tested 41 healthy people aged 14-22 for one lab night against polysomnography (PSG, the sleep-lab reference).
It detected sleep well (95.5% sensitivity) and wake poorly (48.1% specificity). Deep sleep came out about 20 minutes underestimated, REM about 17 overestimated. The same paper describes Oura’s own 2016 internal report: 14 people, total-sleep-time agreement limits running from roughly 64 minutes too low to 66 too high.
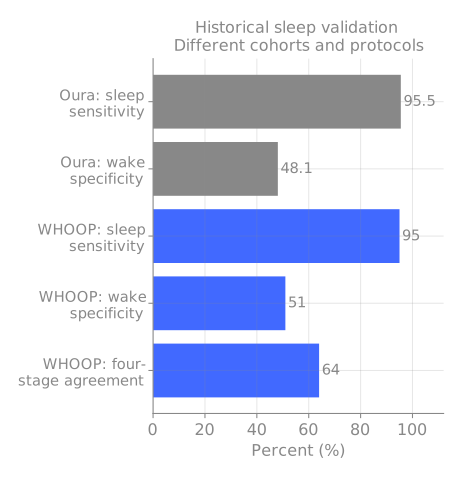
WHOOP’s 2020 sleep study used 12 healthy adults over 86 lab sleeps: 89% sleep/wake agreement but only 64% four-stage agreement, with researchers entering bedtimes and the company scoring recordings. A separate university-run, WHOOP-funded study found a 13.8-minute sleep-duration bias in 32 participants.
Oura’s sleep validation never validated its other scores; Temple’s pulse accuracy doesn’t validate BrainFlow, Entropy or Span. These historical cohorts and endpoints also can’t rank today’s hardware against today’s hardware but I think it’s cool to see where all of it started.
Either way - it’s good that this exists. We want more research like this, and more users playing around with the data.
Where I land
However this launch and pilot go, imo we should be bullish on hardware startups - not just because it’s made in India (although it’s very cool it is) but because we’re playing in leagues and comparisons beyond our usual bounds and doing well at it and we want to see more of it.
I’m probably not gonna go out of my way to get a Temple, half because of the price being higher than basically any baseline accurate sensors for my life and secondly I do think keeping a device glued to your head is likely much harder than a band that disappears on your wrist.
TLDR: We should critique where we need to, but you gotta admit it’s pretty cool.
Methods, all results and reproduction
This analysis uses company-released data, the original dataset is licensed by Temple Private Limited under CC BY-NC 4.0.
- analysis.py: whole-session results and paired comparisons; results.json.
- hr_extended.py: tails, heart-rate bands, sex and wrist-position subgroups, offset sensitivity; hr_extended.json.
- coverage.py: coverage, all-device matched-second comparisons, offset grid; coverage.json.
- plots_final.py: chart generation; README with commands and limitations.
Sources
Heart-rate white paper · Raw/clean recordings · Doppler preprint · Doppler full manuscript · NIRS preprint · Age preprint · Temple science page · Deepinder’s open letter coverage · Throat microphone mechanism · Original AirPods technical spec